Real-Time Dashboards: Track Your KPIs Without Losing Sight of the Big Picture


Real-Time Dashboards: Track Your KPIs Without Losing Sight of the Big Picture
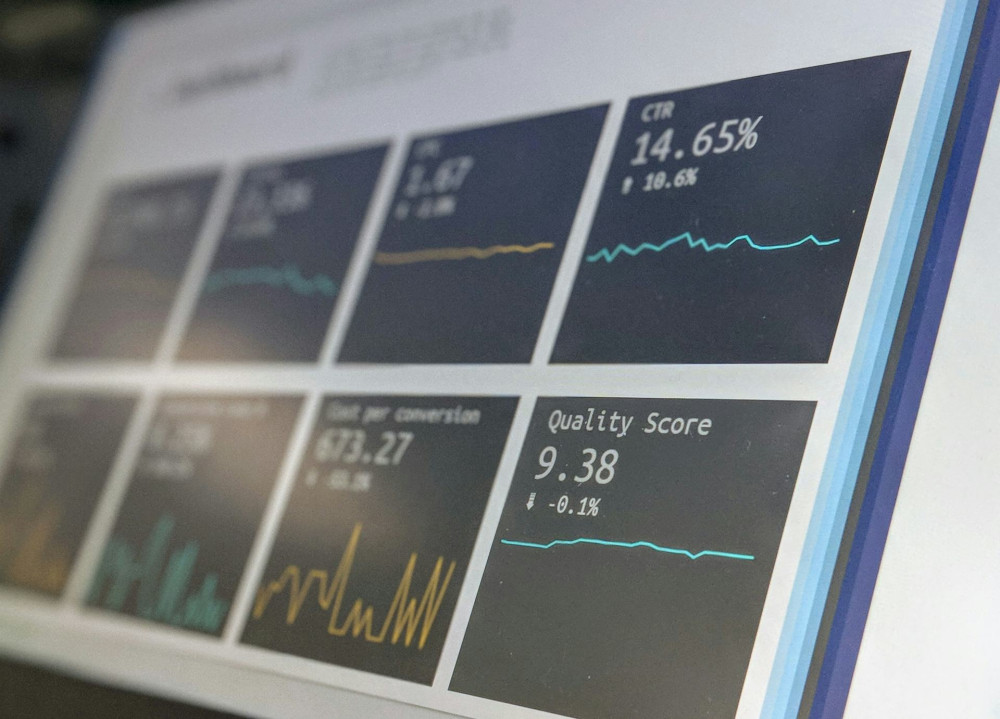
In a world where data moves faster than ever, the ability to monitor your key performance indicators (KPIs) in real time has become a major competitive advantage. Whether you work in marketing, sales, operations, or customer support, a well-designed dashboard can give you clarity, confidence, and control in a busy workday. But how do you make sure your dashboard is more than just a collection of colorful charts—and instead a true management tool that helps you make better decisions?
What Does “Real Time” Really Mean?
When we talk about real-time dashboards, it doesn’t necessarily mean data updates every millisecond. It means your data refreshes continuously, so you always see the latest status—without waiting for weekly reports or manual updates.
For an e-commerce business, that might mean tracking sales hour by hour. For a manufacturing company, it could mean monitoring machine uptime. For a marketing team, it might be seeing campaign performance as it happens.
Real-time data allows you to act quickly—adjust budgets, shift strategies, or spot issues before they escalate.
From Data to Insight—and Action
A dashboard is only as valuable as the decisions it drives. Many organizations are drowning in data but lack focus. That’s why you should start by defining which KPIs truly matter to your business.
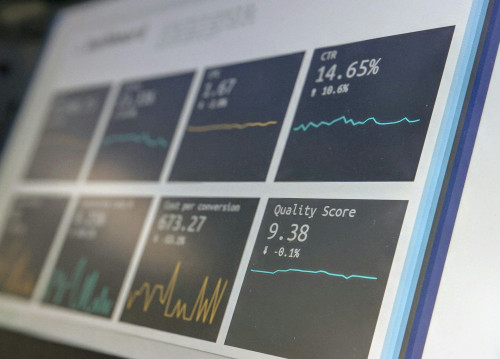
- Marketing: click-through rates, conversions, cost per lead.
- Sales: pipeline value, close rate, average deal size.
- Customer Service: response time, customer satisfaction, cases per agent.
- Operations: production speed, error rate, delivery time.
Once you’ve identified your most important metrics, build a dashboard that presents them clearly and simply. The goal isn’t to show everything—it’s to show what makes a difference.
Design with Purpose
A great dashboard should be intuitive. Use colors, charts, and indicators thoughtfully. Green means “on track,” red means “needs attention”—but don’t overdo it. Too many visual elements can create noise instead of clarity.
Also consider who will use the dashboard. An executive might need a high-level overview, while a marketing specialist may need more detailed data. It often makes sense to create multiple versions—one strategic dashboard for leadership and one operational dashboard for day-to-day users.
Læs også:

Integration and Automation
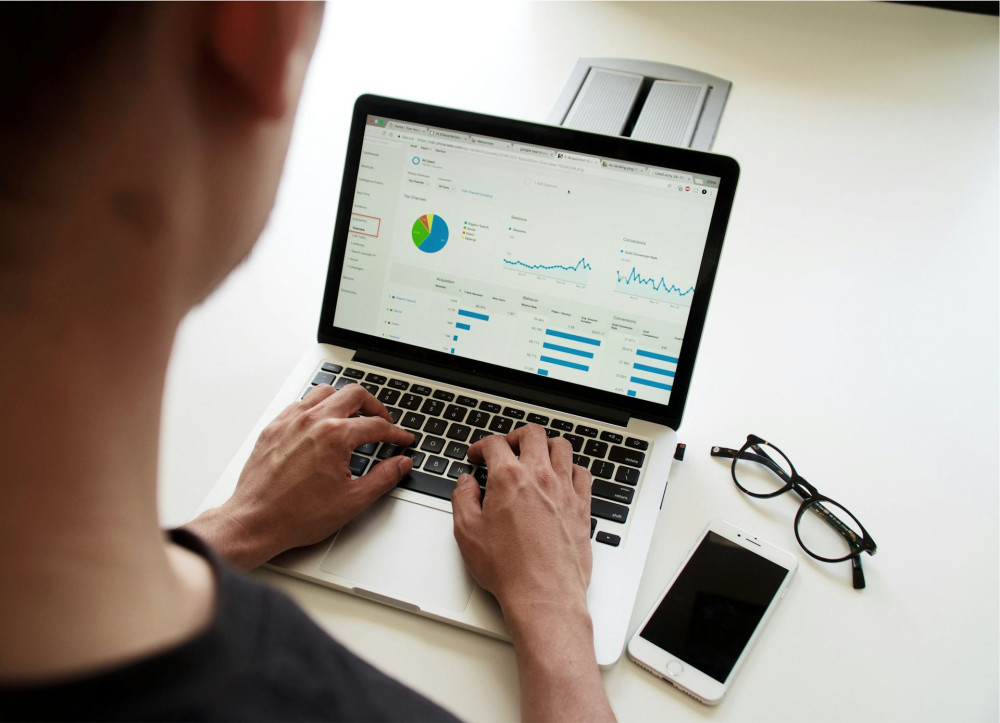
Real-time dashboards depend on connected data sources. These might include your CRM, Google Analytics, social media platforms, ERP systems, or production data. Modern tools like Power BI, Tableau, and Google Looker Studio make it easier to combine data from multiple sources and update it automatically.
Automation saves time and reduces the risk of human error. It also ensures that everyone in the organization is working from the same numbers—making collaboration and decision-making more consistent.
Avoid the Common Pitfalls
While dashboards can be powerful, there are a few traps to avoid:
- Too many KPIs: A dashboard with 30 metrics creates confusion. Focus on 5–10 that truly matter.
- Lack of context: Numbers without explanation can mislead. Add comparisons, goals, or historical data.
- No ownership: If no one is responsible for following up on the data, the dashboard loses its value. Assign accountability for each area.
- Overly complex design: A dashboard should be easy to use—even for those who aren’t data experts.
From Reporting Tool to Company Culture
When used effectively, dashboards become more than a reporting tool—they become part of your company’s culture. They promote transparency, shared goals, and ongoing dialogue about performance. But this only happens if leadership sets the example by using dashboards actively in meetings and decision-making.
A good dashboard isn’t a one-time project—it’s a living tool that evolves with your business. New goals, new campaigns, and new markets require regular updates. The key is to ensure your dashboard always reflects what matters most right now.
Clarity in a Data-Driven World
In a world where data can feel overwhelming, a clear and up-to-date dashboard acts like a compass. It helps you navigate, prioritize, and act—without losing sight of the bigger picture.
Real-time insight isn’t about reacting faster at all costs—it’s about reacting smarter. When you can see your KPIs in real time, you gain more than numbers—you gain the insight to turn information into action. And that’s where true decision-making power begins.
Læs også: